

Unlock stock market secrets! Learn mastering advanced chart tools with technical analysis. Understand candlestick patterns, indicators, and strategies for profi
Unlock stock market secrets! Learn mastering advanced chart tools with technical analysis. Understand candlestick patterns, indicators, and strategies for profitable trading in NSE & BSE.
Master Advanced Charting & Technical Analysis for Indian Markets
Introduction: Decoding the Language of the Markets
The Indian stock market, encompassing the National Stock Exchange (NSE) and the Bombay Stock Exchange (BSE), presents a dynamic landscape filled with opportunities for astute investors. However, navigating this terrain requires more than just luck or intuition. It demands a solid understanding of market dynamics, and a crucial tool in this arsenal is technical analysis. Technical analysis involves studying historical price and volume data to identify patterns and trends that can help predict future price movements. At the heart of technical analysis lies the art of charting, transforming raw data into visual representations that reveal underlying market sentiment and potential trading opportunities. For Indian investors looking to enhance their returns from equity markets, mutual funds, or even SIPs linked to market performance, a strong grasp of advanced charting techniques is indispensable.
Understanding the Building Blocks: Chart Types & Timeframes
Before diving into advanced techniques, let’s establish a foundation by exploring the fundamental chart types and timeframes used in technical analysis:
- Line Charts: The simplest chart type, connecting closing prices over a specified period. Useful for identifying broad trends.
- Bar Charts (OHLC): Offer more information, displaying the Open, High, Low, and Close prices for each period.
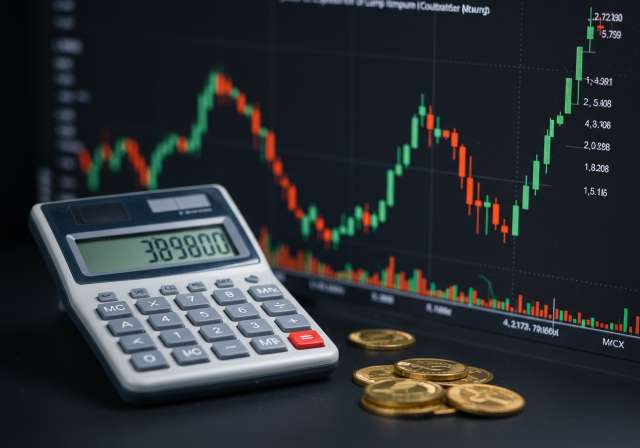
- Candlestick Charts: The most popular chart type, providing a visual representation of price action, including the open, high, low, and close. The “body” represents the difference between the open and close, while the “wicks” or “shadows” represent the price extremes within the period. These are especially useful in identifying short-term price movements.
Choosing the appropriate timeframe is equally crucial. Common timeframes include:
- Intraday: 1-minute, 5-minute, 15-minute, 30-minute, and 1-hour charts. Used for short-term trading and scalping.
- Daily: Reflects price movements over a single day. Useful for short- to medium-term trading.
- Weekly: Shows price action over a week. Ideal for identifying medium-term trends.
- Monthly: Represents price movements over a month. Suited for long-term investors and trend analysis.
Indian investors considering investments like ELSS (Equity Linked Savings Schemes) for tax benefits or long-term SIPs should primarily focus on daily, weekly and monthly charts to understand the overall trend of their chosen assets. Traders using derivatives need to focus on intraday and daily charts for quick decisions.
Decoding Candlestick Patterns: Whispers of the Market
Candlestick patterns are visual formations that offer clues about potential price reversals or continuations. Mastering the art of interpreting these patterns can significantly improve your trading accuracy. Some common candlestick patterns include:
- Doji: A candle with a small or nonexistent body, indicating indecision in the market.
- Hammer/Hanging Man: A small body with a long lower wick, suggesting a potential bullish reversal (Hammer) or bearish reversal (Hanging Man).
- Engulfing Patterns (Bullish/Bearish): A candle that completely engulfs the previous candle’s body, signaling a potential reversal of the prevailing trend.
- Morning Star/Evening Star: Three-candle patterns that indicate potential bullish (Morning Star) or bearish (Evening Star) reversals.
- Piercing Line/Dark Cloud Cover: Two-candle patterns suggesting bullish (Piercing Line) or bearish (Dark Cloud Cover) reversals.
Remember to always confirm candlestick patterns with other technical indicators before making trading decisions. A single pattern does not provide a complete picture.
Technical Indicators: Confirming Trends and Identifying Opportunities
Technical indicators are mathematical calculations based on price and volume data that can help confirm trends, identify overbought/oversold conditions, and generate trading signals. Here are some commonly used indicators:
- Moving Averages (MA): Smooth out price data to identify the underlying trend. Common types include Simple Moving Average (SMA) and Exponential Moving Average (EMA). EMA gives more weightage to the latest prices.
- Relative Strength Index (RSI): Measures the magnitude of recent price changes to evaluate overbought or oversold conditions. Values above 70 suggest overbought conditions, while values below 30 indicate oversold conditions.
- Moving Average Convergence Divergence (MACD): A trend-following momentum indicator that shows the relationship between two moving averages of prices.
- Stochastic Oscillator: Compares a security’s closing price to its price range over a given period. Used to identify overbought and oversold conditions.
- Bollinger Bands: Consist of a moving average and two bands plotted above and below the moving average. The bands expand and contract as volatility increases and decreases.
- Volume Weighted Average Price (VWAP): Averages the price that a stock has traded at throughout the day, based on both price and volume. Useful for intraday traders to identify buying or selling pressure.
Indian investors should remember that no single indicator is foolproof. It’s best to use a combination of indicators to confirm signals and reduce the risk of false positives.
Advanced Charting Techniques: Taking Your Analysis to the Next Level
Beyond basic charting and indicators, several advanced techniques can further refine your technical analysis skills:
- Fibonacci Retracements: Identify potential support and resistance levels based on Fibonacci ratios (23.6%, 38.2%, 50%, 61.8%, 78.6%). These levels often act as magnets for price action.
- Elliott Wave Theory: A complex theory that attempts to identify repeating wave patterns in stock prices to predict future movements.
- Ichimoku Cloud: A comprehensive indicator that provides support and resistance levels, trend direction, and momentum signals.
- Harmonic Patterns: Geometric price patterns that use Fibonacci ratios to predict potential reversals. Common patterns include Gartley, Butterfly, Crab, and Bat patterns.
- Volume Analysis: Analyzing volume patterns to confirm price movements. Increasing volume during an uptrend suggests strong bullish sentiment, while increasing volume during a downtrend indicates strong bearish sentiment.
- Heikin-Ashi Charts: A type of candlestick chart that averages price data to smooth out price fluctuations and make it easier to identify trends.
Putting it All Together: A Practical Approach
Technical analysis is not just about memorizing patterns and indicators; it’s about applying them strategically and understanding the context of the market. Here’s a practical approach to using advanced charting techniques:
- Identify the Trend: Use long-term charts (weekly or monthly) to determine the overall trend of the market or the specific asset you’re analyzing.
- Select Appropriate Timeframes: Choose timeframes that align with your trading style and investment horizon.
- Apply Relevant Indicators: Select indicators that complement each other and provide confirming signals. Avoid using too many indicators, as this can lead to confusion and conflicting signals.
- Identify Key Support and Resistance Levels: Use Fibonacci retracements, trendlines, and previous highs and lows to identify potential support and resistance levels.
- Analyze Candlestick Patterns: Look for candlestick patterns that confirm potential reversals or continuations of the trend.
- Consider Volume Analysis: Use volume analysis to confirm price movements and gauge the strength of the trend.
- Manage Risk: Always use stop-loss orders to limit potential losses and protect your capital.
- Stay Updated: The market is constantly evolving, so it’s important to stay updated on the latest technical analysis techniques and market trends. Follow reputable financial news sources, attend webinars, and continue learning.
For example, if you are considering investing in a mutual fund, analyze the fund’s underlying assets using these techniques. A fund heavily invested in IT stocks should be analyzed using sectoral indices related to IT on NSE.
The Role of SEBI and Risk Management
The Securities and Exchange Board of India (SEBI) plays a vital role in regulating the Indian stock market and protecting investors. While technical analysis can significantly enhance your trading skills, it’s crucial to remember that it’s not a foolproof method. Market conditions can change rapidly, and unexpected events can impact prices. Always prioritize risk management and never invest more than you can afford to lose. Diversification is key to mitigating risk. Consider allocating your investments across different asset classes, such as equity, debt, and gold. Additionally, options strategies can be used to hedge your portfolio against market volatility. Never rely solely on technical analysis to make investment decisions. Consider fundamental analysis, economic indicators, and company-specific news to gain a more comprehensive understanding of the market.
Conclusion: Mastering the Art of Charting
Technical analysis is a powerful tool that can help Indian investors make more informed trading decisions. By understanding chart types, candlestick patterns, technical indicators, and advanced charting techniques, you can gain a competitive edge in the market. Remember that mastering advanced chart tools with technical analysis requires time, dedication, and practice. Continuously refine your skills, adapt to changing market conditions, and always prioritize risk management. With consistent effort and a disciplined approach, you can unlock the secrets of the market and achieve your financial goals. Also remember to consider your overall financial goals. A long-term goal such as building a retirement fund using PPF or NPS might not need day-to-day market analysis.


