
Unlock trading success with charting tools! Learn the importance of charting tools in trading, understand chart patterns, and analyze market trends. Maximize yo
Unlock trading success with charting tools! Learn the importance of charting tools in trading, understand chart patterns, and analyze market trends. Maximize your returns on NSE and BSE!
Mastering Markets: The Power & Importance of Charting Tools in Trading
Introduction: Navigating the Indian Financial Landscape
The Indian financial market, with its bustling exchanges like the National Stock Exchange (NSE) and the Bombay Stock Exchange (BSE), offers a plethora of opportunities for investors. From seasoned traders to newcomers dipping their toes into the world of equity markets, mutual funds, and IPOs, the potential for wealth creation is immense. However, navigating this complex landscape requires more than just intuition; it demands a strategic approach, informed decision-making, and a deep understanding of market trends. This is where charting tools come into play, acting as indispensable companions for anyone serious about trading and investing in India.
Think of the Indian stock market as a vast ocean. Without a map, compass, or navigational instruments, you’d be adrift at sea, vulnerable to unpredictable currents and hidden dangers. Charting tools are precisely those instruments, providing the visual aids and analytical capabilities needed to chart a course towards profitable outcomes. They transform raw market data into easily digestible visual representations, empowering investors to identify patterns, predict future price movements, and manage risk effectively.
Decoding the Language of Charts: A Visual Gateway to Market Insights
At their core, charting tools are about visualizing market data. Instead of sifting through endless spreadsheets of numbers, traders can instantly grasp the historical performance of a stock, commodity, or index through graphical representations. These charts can take various forms, each offering unique insights:
- Line Charts: The simplest form, connecting closing prices over a period. Useful for identifying overall trends.
- Bar Charts: Display the open, high, low, and close prices for each period. Provide more detailed information than line charts.
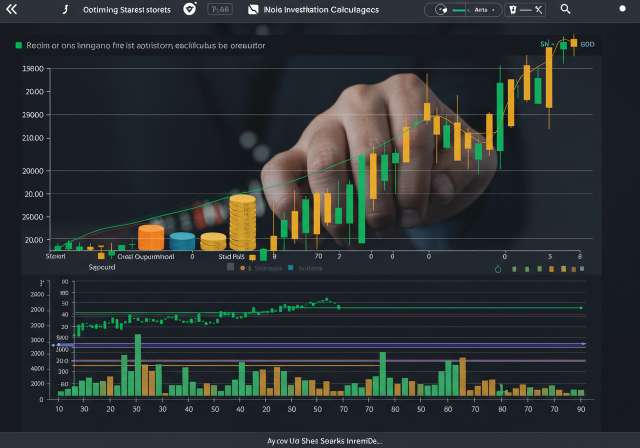
- Candlestick Charts: A variation of bar charts, using different colors to indicate whether the closing price was higher or lower than the opening price. Highly popular due to their visual clarity and ability to highlight price action. A green (or white) candlestick signifies a bullish (rising) price, while a red (or black) candlestick indicates a bearish (falling) price.
- Point and Figure Charts: Focus solely on price movements, filtering out time. Used to identify support and resistance levels.
Each chart type offers a unique perspective, and experienced traders often utilize a combination of these to gain a comprehensive understanding of market dynamics. Understanding these basics is critical before even considering more advanced analysis.
Technical Indicators: Amplifying the Power of Charting Tools
Charting tools go beyond simple price visualization. They also incorporate a vast array of technical indicators, mathematical calculations based on historical price and volume data that are designed to predict future price movements. These indicators can be overlaid on charts to provide additional layers of analysis.
Popular Technical Indicators for Indian Traders:
- Moving Averages (MA): Smooth out price data to identify trends. Common types include Simple Moving Average (SMA) and Exponential Moving Average (EMA). For example, a 50-day SMA is a popular tool to gauge short to medium term trend of a stock listed on the NSE.
- Relative Strength Index (RSI): Measures the magnitude of recent price changes to evaluate overbought or oversold conditions. An RSI above 70 typically indicates an overbought condition, suggesting a potential price reversal, while an RSI below 30 suggests an oversold condition.
- Moving Average Convergence Divergence (MACD): A trend-following momentum indicator that shows the relationship between two moving averages of a security’s price.
- Bollinger Bands: Measure market volatility by plotting upper and lower bands around a moving average. Price movements outside these bands can signal potential trading opportunities.
- Fibonacci Retracements: Identify potential support and resistance levels based on Fibonacci ratios. These are very popular in the Indian markets.
- Volume Indicators: Analyze trading volume to confirm price trends. For example, On Balance Volume (OBV) is a common tool.
These are just a few examples, and the choice of indicators often depends on the trader’s individual strategy and preferences. Mastering a few key indicators is more effective than trying to use them all at once.
Chart Patterns: Unveiling Hidden Opportunities
Beyond technical indicators, charts also reveal patterns that can provide valuable insights into future price movements. These patterns are formed by specific price formations over time and are often interpreted as signals of continuation or reversal of existing trends.
Common Chart Patterns:
- Head and Shoulders: A reversal pattern indicating a potential trend reversal from bullish to bearish.
- Double Top/Bottom: Another reversal pattern, signaling a potential change in direction.
- Triangles: Can be ascending, descending, or symmetrical, suggesting either continuation or reversal depending on the breakout direction.
- Flags and Pennants: Short-term continuation patterns indicating a brief pause in an existing trend before resuming its course.
The Importance of Charting Tools in Trading for Indian Investors
The real power of charting tools lies in their ability to empower traders to make informed decisions based on objective data rather than gut feelings or speculation. The importance of charting tools in trading stems from their ability to provide a clear and concise view of market dynamics, enabling traders to identify trends, predict price movements, and manage risk effectively.
Here’s how charting tools benefit Indian investors:
- Trend Identification: Easily identify whether a stock is in an uptrend, downtrend, or trading sideways.
- Entry and Exit Points: Pinpoint optimal entry and exit points based on technical indicators and chart patterns.
- Risk Management: Set stop-loss orders and target prices based on support and resistance levels identified through charting.
- Confirmation Signals: Use technical indicators to confirm trading signals generated by other methods.
- Portfolio Diversification: Analyze the performance of different assets and diversify your portfolio accordingly.
- Staying Updated: Keep abreast of market trends and news events that may impact your investments.
Choosing the Right Charting Tool: A Guide for Indian Traders
With numerous charting tools available in the market, selecting the right one can be overwhelming. Here are some key factors to consider:
- User Interface: Choose a tool with an intuitive and user-friendly interface that is easy to navigate.
- Data Availability: Ensure the tool provides access to real-time and historical data for the Indian stock market (NSE & BSE).
- Technical Indicators: Look for a tool that offers a wide range of technical indicators and customizable parameters.
- Chart Types: Select a tool that supports various chart types, including line, bar, candlestick, and point and figure charts.
- Alerts and Notifications: Choose a tool that allows you to set up alerts and notifications for specific price levels or indicator signals.
- Mobile Accessibility: Opt for a tool with a mobile app that allows you to monitor your investments and trade on the go.
- Cost: Consider the cost of the tool and compare it to the features and benefits it offers. Many brokers offer free charting tools as part of their trading platforms.
Popular charting platforms used by Indian traders include Zerodha Kite, Upstox Pro, Angel Broking SpeedPro, and TradingView. It is always best to use a charting platform that also has access to real-time NSE and BSE data feeds.
Beyond Equities: Charting Tools for Other Asset Classes
While charting tools are widely used in the equity markets, their utility extends to other asset classes as well. Indian investors can leverage charting tools to analyze and trade:
- Commodities: Track prices of gold, silver, crude oil, and other commodities traded on the Multi Commodity Exchange (MCX).
- Currencies: Monitor the exchange rates of the Indian Rupee (INR) against other major currencies.
- Derivatives: Analyze futures and options contracts on stocks, indices, and commodities.
- Mutual Funds: While not directly used for intraday trading, charting tools can help analyze the historical performance of mutual funds and make informed investment decisions, especially when considering Systematic Investment Plans (SIPs).
Integrating Charting with Long-Term Investment Strategies (SIPs, ELSS, PPF, NPS)
While charting tools are primarily associated with short-term trading, they can also indirectly support long-term investment strategies. By understanding market cycles and economic trends, investors can make more informed decisions about asset allocation and timing their investments in instruments like:
- Systematic Investment Plans (SIPs): While SIPs are designed for regular investing regardless of market conditions, understanding market cycles can help investors adjust their SIP amounts or consider value averaging strategies.
- Equity Linked Savings Schemes (ELSS): ELSS funds offer tax benefits under Section 80C of the Income Tax Act. Charting tools can help analyze the historical performance of different ELSS funds and identify those with strong growth potential.
- Public Provident Fund (PPF): PPF is a long-term debt instrument offering guaranteed returns. While charting tools are not directly applicable to PPF, understanding broader economic trends can help investors assess the relative attractiveness of PPF compared to other investment options.
- National Pension System (NPS): NPS is a retirement savings scheme that allows investors to allocate their funds across different asset classes. Charting tools can help analyze the performance of different asset classes and adjust the asset allocation accordingly.
Conclusion: Empowering Your Trading Journey with Charting Tools
In conclusion, charting tools are essential for anyone looking to succeed in the Indian financial market. They provide a visual and analytical framework for understanding market dynamics, identifying trends, and making informed trading decisions. By mastering the art of chart analysis and incorporating technical indicators into your trading strategy, you can significantly improve your chances of achieving your financial goals. Whether you’re a seasoned trader or a beginner investor, embracing charting tools is a crucial step towards becoming a more confident and successful participant in the Indian stock market and beyond. Remember that proper risk management and a thorough understanding of the instruments you trade are always paramount.


