
Unlock trading success with charting tools! Learn the importance of charting tools in trading for NSE & BSE, analyze trends, manage risk, and boost your returns
Unlock trading success with charting tools! Learn the importance of charting tools in trading for NSE & BSE, analyze trends, manage risk, and boost your returns. A must-read for Indian investors!
Mastering the Market: Charting Tools for Indian Traders
Introduction: Navigating the Indian Stock Market with Precision
The Indian stock market, comprising the National Stock Exchange (NSE) and the Bombay Stock Exchange (BSE), presents a dynamic landscape filled with opportunities and risks. For investors, from seasoned traders to beginners dipping their toes into the world of equity markets, understanding market trends is paramount. This understanding forms the bedrock of informed investment decisions. In this context, charting tools emerge as indispensable assets, providing visual representations of price movements and enabling in-depth analysis.
Think of the Indian market as a vast ocean. Without a compass and a map, navigating it would be treacherous. Charting tools act as that compass and map, guiding traders through the complexities of the market and helping them make profitable decisions.
Decoding Charts: A Visual Language for Investors
Charting tools transform raw market data – price, volume, and time – into visual formats that are easily digestible. These charts come in various forms, each offering a unique perspective on market dynamics. Let’s explore some common types:
- Line Charts: The simplest form, connecting closing prices over a period. Useful for identifying overall trends.
- Bar Charts: Display the open, high, low, and close prices for each period. Provide a more detailed view than line charts.
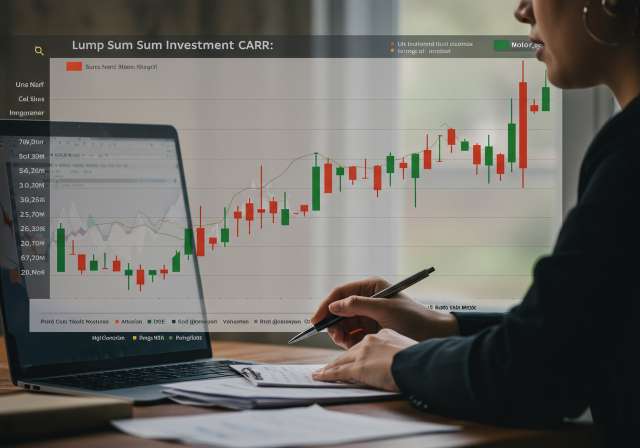
- Candlestick Charts: A visually appealing and informative type, showing the open, high, low, and close prices. The ‘body’ of the candle represents the difference between the open and close prices, while the ‘wicks’ show the high and low. Candlestick patterns can indicate potential trend reversals. They are widely used by Indian traders.
- Point and Figure Charts: Focus solely on price movements, ignoring time. Useful for identifying support and resistance levels.
For Indian investors engaging in intraday trading or even long-term investments through SIPs (Systematic Investment Plans) in mutual funds, understanding these chart types is crucial. They can help you identify potential entry and exit points, minimizing losses and maximizing returns.
Technical Indicators: Unveiling Hidden Market Signals
Beyond the basic chart types, technical indicators add another layer of analysis. These are mathematical calculations based on price and volume data, designed to provide signals about market direction and strength. Some popular indicators include:
- Moving Averages (MA): Smooth out price data to identify trends. Widely used for both short-term and long-term analysis. A common strategy is to use the crossing of two moving averages (e.g., a 50-day MA and a 200-day MA) to signal potential buy or sell opportunities.
- Relative Strength Index (RSI): Measures the magnitude of recent price changes to evaluate overbought or oversold conditions in the price of a stock or other asset. Values above 70 suggest overbought conditions, while values below 30 suggest oversold conditions.
- Moving Average Convergence Divergence (MACD): A trend-following momentum indicator that shows the relationship between two moving averages of prices. Can be used to identify potential buy and sell signals.
- Bollinger Bands: Volatility bands placed above and below a moving average. When prices touch the upper band, it may indicate overbought conditions, and when they touch the lower band, it may indicate oversold conditions.
- Volume Indicators: Analyze trading volume to confirm price trends. For example, an increase in volume during an uptrend strengthens the bullish signal.
- Fibonacci Retracement: Uses Fibonacci ratios to identify potential support and resistance levels.
These indicators can be applied to charts of various Indian stocks listed on the NSE and BSE, providing valuable insights into their potential future movements. However, it’s essential to remember that no indicator is foolproof, and they should be used in conjunction with other analysis techniques.
Benefits of Using Charting Tools in Trading
The benefits of incorporating charting tools into your trading strategy are numerous and can significantly enhance your ability to navigate the Indian stock market effectively:
- Trend Identification: Charting tools allow you to easily identify trends, whether they are upward (bullish), downward (bearish), or sideways (range-bound). This helps you align your trading strategy with the prevailing market conditions.
- Support and Resistance Levels: These are price levels where the market has historically found buying or selling pressure. Charting tools help you identify these levels, which can be used to set entry and exit points.
- Pattern Recognition: Charts often form patterns that can indicate potential future price movements. Examples include head and shoulders, double tops, double bottoms, and triangles. Recognizing these patterns can give you a significant edge.
- Risk Management: Charting tools can help you set stop-loss orders based on support and resistance levels, limiting your potential losses. They also allow you to calculate potential profit targets.
- Improved Timing: By analyzing charts and indicators, you can improve the timing of your trades, entering positions when the odds are in your favor.
- Data Visualization: Complex market data is simplified into visual representations that are easier to understand and interpret.
- Backtesting Strategies: Many charting platforms allow you to backtest your trading strategies using historical data, helping you to refine your approach and improve its effectiveness.
Choosing the Right Charting Tool for Indian Markets
Several charting platforms cater specifically to the Indian market, offering real-time data from the NSE and BSE, as well as support for various technical indicators and analytical tools. When selecting a charting platform, consider the following factors:
- Data Accuracy and Reliability: Ensure the platform provides accurate and reliable real-time data from the NSE and BSE.
- User-Friendliness: The platform should be easy to use and navigate, with a clear and intuitive interface.
- Customization Options: Look for a platform that allows you to customize charts and indicators to your preferences.
- Technical Indicators: The platform should offer a wide range of technical indicators.
- Backtesting Capabilities: The ability to backtest your strategies is a valuable feature.
- Mobile Accessibility: A mobile app can be useful for monitoring your positions and analyzing charts on the go.
- Cost: Compare the pricing of different platforms and choose one that fits your budget. Many brokers offer free charting tools as part of their trading platform.
Importance of Charting Tools in Trading for Profitable Investing
The Indian stock market, while offering substantial growth potential, demands astute analysis and strategic decision-making. The proper utilization of charting tools empowers investors and traders to dissect market dynamics effectively. By visually representing price trends, pinpointing support and resistance thresholds, and employing technical indicators, charting tools play a crucial role in refining trading strategies and mitigating potential risks. Understanding these tools is paramount for making well-informed investment choices in equity markets, whether it’s investing in direct equity, ELSS (Equity Linked Savings Scheme) for tax benefits, or through SIPs in diversified mutual funds. Integrating charting analysis enables investors to identify optimal entry and exit points, thereby bolstering their chances of success in the Indian financial landscape.
Example Scenario: Using Charts to Analyze Reliance Industries
Let’s consider a hypothetical scenario where an Indian investor wants to analyze the stock of Reliance Industries (a prominent company listed on both NSE and BSE) using charting tools.
- Choosing a Charting Platform: The investor selects a charting platform offered by their broker or a third-party provider.
- Selecting a Chart Type: They choose a candlestick chart with a daily timeframe to get a detailed view of price movements.
- Adding Moving Averages: They add a 50-day and a 200-day moving average to identify the overall trend. If the 50-day MA crosses above the 200-day MA, it could be a bullish signal.
- Applying RSI: They apply the RSI to identify overbought or oversold conditions. If the RSI is above 70, the stock may be overbought and due for a correction.
- Identifying Support and Resistance: They identify key support and resistance levels based on historical price data.
- Analyzing Candlestick Patterns: They look for candlestick patterns that might indicate potential trend reversals, such as a “hammer” or a “shooting star.”
Based on this analysis, the investor can make informed decisions about whether to buy, sell, or hold the stock of Reliance Industries.
Beyond Stocks: Charting Tools for Other Investments
While primarily used for analyzing stocks, charting tools can also be applied to other investment instruments available in the Indian market:
- Commodities: Analyzing price trends in gold, silver, and other commodities traded on the Multi Commodity Exchange (MCX).
- Currency Markets: Tracking the exchange rate of the INR against other currencies.
- Bonds: Analyzing the yield and price movements of government and corporate bonds.
Even for long-term investments like PPF (Public Provident Fund) and NPS (National Pension System), understanding broader economic trends through market analysis can indirectly inform your investment strategy. While these instruments aren’t directly traded, understanding economic cycles can influence your asset allocation within these schemes.
Conclusion: Empowering Your Investment Journey with Charting Tools
In conclusion, mastering the use of charting tools is an essential skill for any serious investor in the Indian stock market. By providing a visual representation of market data and enabling in-depth analysis, these tools empower you to make informed decisions, manage risk effectively, and ultimately increase your chances of achieving your financial goals. Embrace the power of charting and embark on a more confident and profitable investment journey in the Indian market.


