
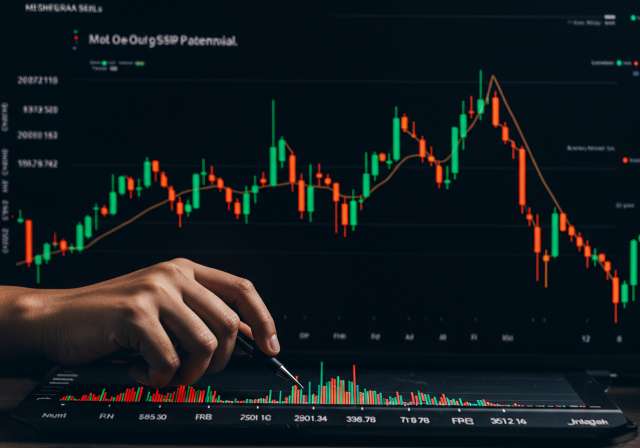

Decode your investments with a monthly result chart. Understand performance, track growth & make informed decisions. Learn to analyze & optimize your portfolio
Decode your investments with a monthly result chart. Understand performance, track growth & make informed decisions. Learn to analyze & optimize your portfolio for better returns. Ideal for mutual fund SIPs, stocks & more!
Mastering Your Finances: A Comprehensive Guide to Understanding Monthly Result Charts
Introduction: Navigating the Indian Investment Landscape
The Indian financial market is a dynamic and ever-evolving landscape, offering a plethora of investment opportunities. From the established giants listed on the NSE and BSE to the burgeoning world of mutual funds and SIPs (Systematic Investment Plans), Indian investors have more choices than ever before. However, with great choice comes great responsibility – the responsibility to understand and manage your investments effectively. One crucial tool for achieving this is the comprehensive analysis of your portfolio’s performance using tools like a monthly result chart.
Before diving into the intricacies of interpreting performance data, it’s vital to understand the broader investment ecosystem. Let’s briefly touch upon some common investment avenues preferred by Indian investors:
- Equity Markets: Investing directly in stocks of companies listed on the NSE and BSE offers the potential for high returns, but also comes with inherent risk.
- Mutual Funds: A popular choice for diversification, mutual funds pool money from multiple investors to invest in a diversified portfolio of stocks, bonds, or other assets. Options abound, ranging from equity funds to debt funds and hybrid funds.
- SIPs (Systematic Investment Plans): SIPs allow you to invest a fixed amount regularly, typically monthly, in a mutual fund scheme. This disciplined approach helps average out the cost of investment and is a favored strategy for long-term wealth creation.
- ELSS (Equity Linked Savings Scheme): ELSS funds are equity mutual funds that offer tax benefits under Section 80C of the Income Tax Act. They come with a mandatory lock-in period of 3 years.
- Debt Instruments: These include fixed deposits (FDs), corporate bonds, and government bonds. They offer relatively lower risk and predictable returns.
- PPF (Public Provident Fund): A government-backed savings scheme offering tax benefits and guaranteed returns. It has a lock-in period of 15 years.
- NPS (National Pension System): A retirement savings scheme that allows you to contribute regularly during your working life and receive a pension upon retirement.
- Real Estate: Investing in property can be a lucrative option, but it requires significant capital and involves liquidity challenges.
- Gold: A traditional investment in India, gold is often considered a safe haven during times of economic uncertainty.
Each of these investment options has its own risk-reward profile, and the right choice depends on your individual financial goals, risk tolerance, and investment horizon. Regardless of the investment type, tracking performance is crucial.
The Importance of Tracking Investment Performance
Imagine setting sail on a long voyage without a compass or a map. You might eventually reach your destination, but the journey would be fraught with uncertainty and inefficiency. Similarly, investing without tracking performance is like navigating the financial seas blindly. Here’s why monitoring your investments is essential:
- Informed Decision-Making: Tracking performance provides valuable insights into how your investments are performing against your expectations. This allows you to make informed decisions about whether to continue investing in a particular asset, rebalance your portfolio, or explore alternative options.
- Identifying Strengths and Weaknesses: Analyzing your investment performance helps you identify the strengths and weaknesses of your portfolio. You can see which investments are generating the highest returns and which ones are underperforming.
- Risk Management: By tracking performance, you can assess whether your portfolio’s risk level aligns with your risk tolerance. If you notice that your investments are fluctuating wildly, you may need to adjust your asset allocation to reduce risk.
- Goal Alignment: Regular performance monitoring ensures that your investments are on track to meet your financial goals, such as retirement planning, children’s education, or buying a home.
- Opportunity Identification: Observing trends in your investment performance can help you identify emerging opportunities in the market. You may discover new investment options that align with your risk profile and offer higher potential returns.
SEBI (Securities and Exchange Board of India), the regulatory body for the Indian securities market, emphasizes the importance of investor awareness and education. Tracking your investment performance is a fundamental aspect of being a responsible and informed investor.
Decoding the Elements of a Monthly Result Chart
A monthly result chart is a powerful tool that helps you visualize and analyze your investment performance over time. While the specific format may vary depending on the platform you use (e.g., your broker’s website, a mutual fund statement, or a spreadsheet you create yourself), the key elements remain consistent. Understanding these elements is crucial for effective interpretation.
Essential Components
- Investment Name/Asset Class: Clearly identifies the specific investment being tracked, such as a particular stock, mutual fund scheme, or asset class (e.g., equity, debt, gold).
- Beginning Balance: The value of the investment at the beginning of the month.
- Contributions/Withdrawals: Any additions (e.g., SIP investments) or withdrawals made during the month.
- Month-End Balance: The value of the investment at the end of the month.
- Monthly Return (Absolute): The difference between the month-end balance and the beginning balance, adjusted for contributions and withdrawals. This represents the absolute change in value during the month, expressed in INR (₹).
- Monthly Return (Percentage): The monthly return expressed as a percentage of the beginning balance. This provides a standardized way to compare the performance of different investments.
- Year-to-Date (YTD) Return: The cumulative return from the beginning of the calendar year to the end of the current month. This gives you a broader perspective on your investment’s performance over the year.
- Trailing Returns: Returns calculated over specific periods, such as 3 months, 6 months, 1 year, 3 years, and 5 years. These returns provide insights into the long-term performance of your investments.
Beyond the Basics: Additional Metrics
While the essential components provide a solid foundation, some charts may also include additional metrics that can enhance your analysis:
- Benchmark Comparison: Comparing your investment’s performance against a relevant benchmark index (e.g., Nifty 50 for equity funds) helps you assess whether your investment is outperforming or underperforming the market.
- Risk Metrics: Metrics such as standard deviation and Sharpe ratio provide insights into the volatility and risk-adjusted returns of your investment.
- Expense Ratio (for Mutual Funds): The expense ratio is the annual fee charged by the mutual fund to manage your investment. Understanding the expense ratio is crucial for evaluating the overall cost-effectiveness of the fund.
- Portfolio Allocation: A breakdown of your portfolio’s asset allocation (e.g., percentage allocated to equity, debt, gold) helps you assess whether your portfolio is aligned with your risk tolerance and investment goals.
Analyzing Your Investment Performance: A Step-by-Step Guide
Once you have a monthly result chart, the next step is to analyze the data and draw meaningful conclusions. Here’s a step-by-step guide to help you get started:
- Review the Overall Picture: Start by examining the overall performance of your portfolio. Look at the YTD return and trailing returns to get a sense of how your investments have performed over different time periods.
- Compare Against Benchmarks: Compare your investment’s performance against relevant benchmark indices. If your investment is consistently underperforming the benchmark, it may be time to reconsider your investment strategy.
- Analyze Individual Investments: Examine the performance of each individual investment in your portfolio. Identify the investments that are performing well and those that are underperforming.
- Assess Risk: Evaluate the risk metrics of your investments. If you are uncomfortable with the level of risk, consider adjusting your asset allocation to reduce volatility.
- Evaluate Costs: Pay attention to the expense ratios of your mutual funds. High expense ratios can eat into your returns over time.
- Consider External Factors: Remember that investment performance is influenced by a variety of external factors, such as economic conditions, market sentiment, and geopolitical events. Take these factors into account when analyzing your results.
Optimizing Your Portfolio Based on Performance Analysis
The ultimate goal of tracking and analyzing your investment performance is to optimize your portfolio for better returns. Here are some strategies you can consider based on your analysis:
- Rebalancing: Regularly rebalancing your portfolio ensures that your asset allocation remains aligned with your risk tolerance and investment goals. This involves selling some of your overperforming assets and buying more of your underperforming assets.
- Diversification: Ensure that your portfolio is adequately diversified across different asset classes, sectors, and geographies. Diversification helps reduce risk and improve overall portfolio performance.
- Strategic Asset Allocation: Adjust your asset allocation based on your risk tolerance, investment horizon, and market outlook. For example, if you have a long investment horizon and a high risk tolerance, you may choose to allocate a larger portion of your portfolio to equity.
- Tax-Efficient Investing: Consider the tax implications of your investment decisions. Utilize tax-advantaged accounts such as PPF, NPS, and ELSS to minimize your tax burden.
- Seeking Professional Advice: If you are unsure about how to interpret your investment performance or optimize your portfolio, consider seeking advice from a qualified financial advisor. They can provide personalized guidance based on your individual circumstances.
Conclusion: Taking Control of Your Financial Future
In conclusion, tracking and analyzing your investment performance using a monthly result chart is essential for effective financial management. By understanding the key elements of performance data and applying the strategies outlined above, you can gain valuable insights into your investments, make informed decisions, and optimize your portfolio for better returns. Remember that investing is a long-term journey, and regular monitoring and adjustments are crucial for achieving your financial goals. SEBI encourages investors to stay informed and take control of their financial future through continuous learning and responsible investing practices. By embracing these principles, you can navigate the Indian investment landscape with confidence and build a secure financial future for yourself and your family.


